Open Access
Fig. 7
Download original image
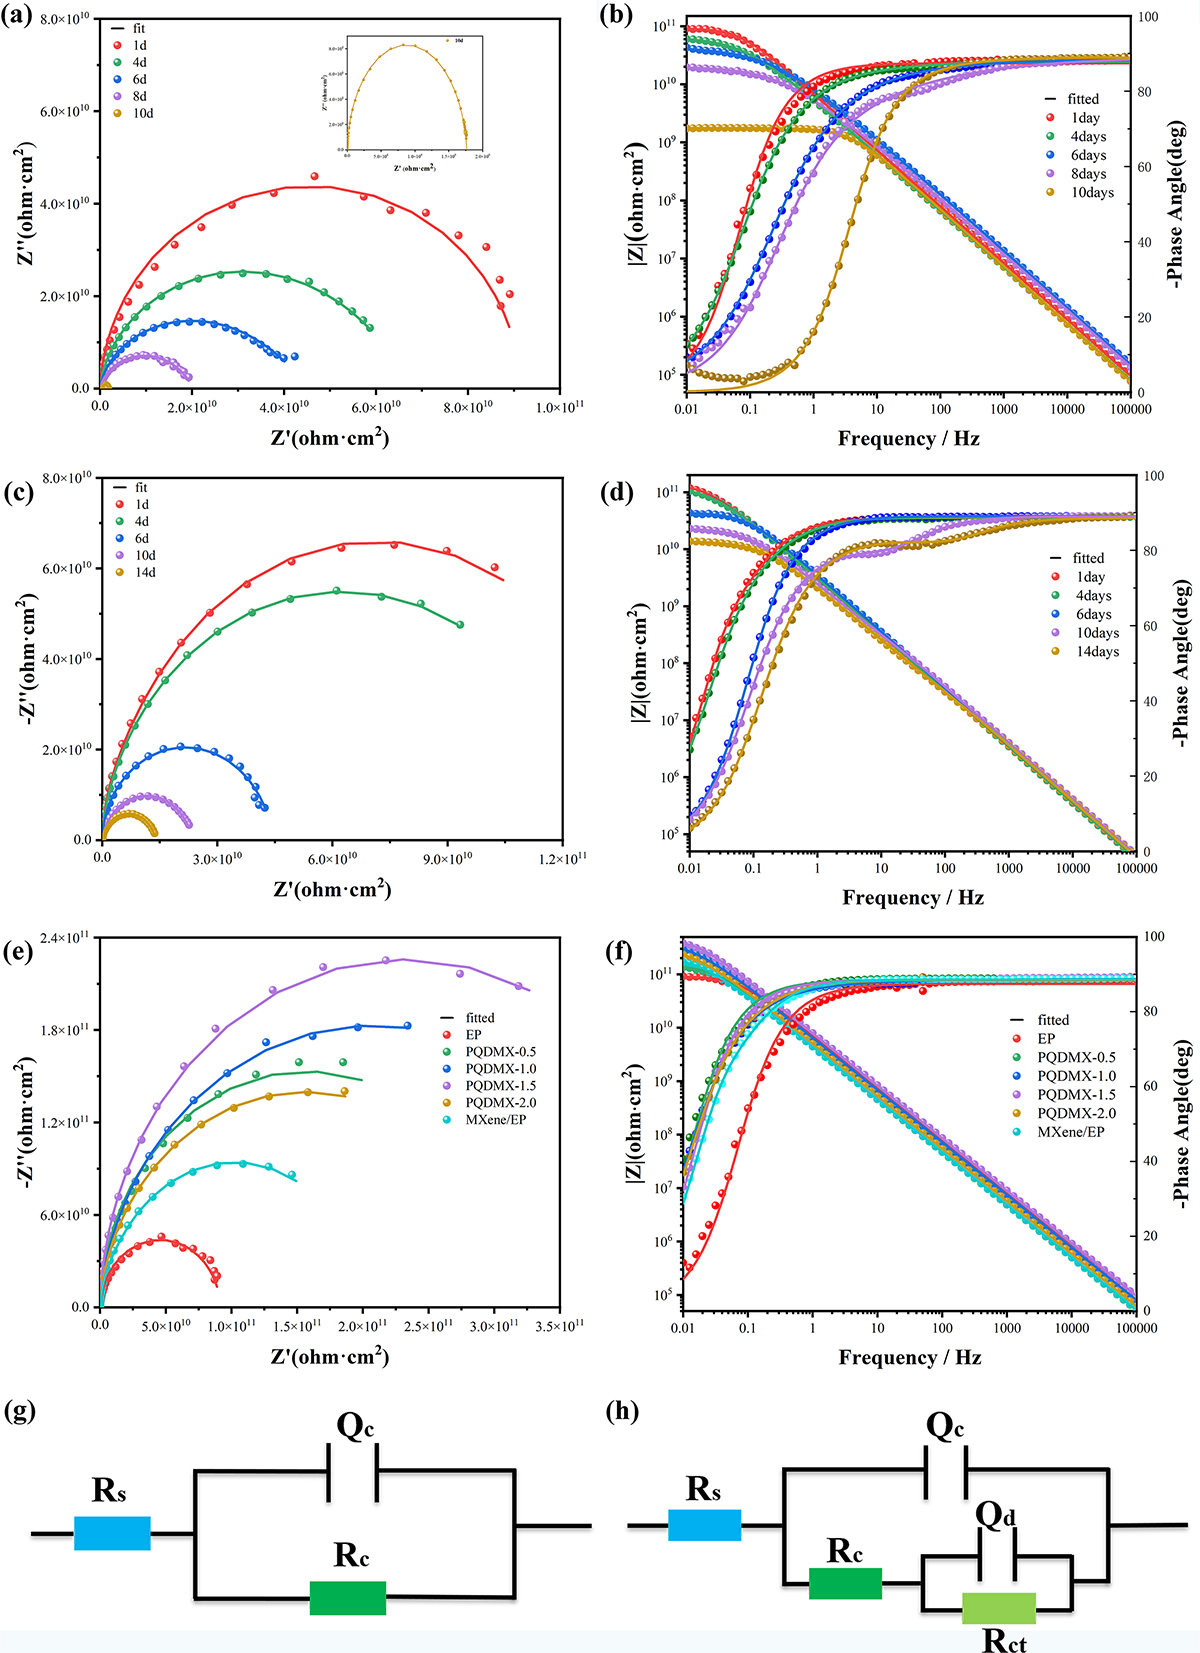
EIS spectra of different composite coatings after immersion in 3.5 wt% NaCl solution, with EP, MXene/EP Nyquist plots (a, c, and e); (b, d, and f) are the Bode plots for EP, MXene/EP; The equivalent circuit diagram of the coating (g) in the early stage and (h) in the middle stage.
Current usage metrics show cumulative count of Article Views (full-text article views including HTML views, PDF and ePub downloads, according to the available data) and Abstracts Views on Vision4Press platform.
Data correspond to usage on the plateform after 2015. The current usage metrics is available 48-96 hours after online publication and is updated daily on week days.
Initial download of the metrics may take a while.